
Background Information
This page contains a collection of projects created for Urbane Cyclist Worker Co-Op. The projects range from video work and copywriting and design work, to more complex brand management work.
Urbane Cyclist is a worker-owned co-operative bike shop located in Downtown Toronto.
THE Process
In my capacity as the Marketing Co-Ordinator at Urbane Cyclist, the bread and butter of the role is video work, and I work to create both long form and short form content.
The long form video content creation workflow looks a bit like performing market research and search console analysis to find topics that will perform well, researching video topics, drafting video concepts, writing scripts, and sourcing materials from vendors prior to filming. Once video concepts are prepared, I also often present video content, work on lighting and operate the cameras, both A-Roll and B-Roll, during the filming process. As a presenter, I also co-host our Bike Banter and Tandem Talks segments. Finally, I am also responsible for editing, promoting, and analyzing the video content after it is published. For editing, I use Adobe Premiere Pro, and occasionally use Adobe AfterEffects to create motion graphics.
I'm very lucky to be able to be a part of every step of the content creation process for many pieces of long form content, but I'm also responsible for ideating, presenting, filming and editing short form content, in the form of shop interviews, and am very comfortable both in front of the camera and behind it, along with sitting in the editor's chair.
In the shop, I also take care of blog writing, social media copywriting, newsletter writing, designing any posters, shop signage, window displays, postcards and business cards, creating apparel and merchandise design, and handle social media management.
The Projects
Video Work
Please visit our YouTube channel to see some of the projects I've worked on while I take some time to curate a selection of works along with their descriptions.
Merchandise Design
This section also coming soon!
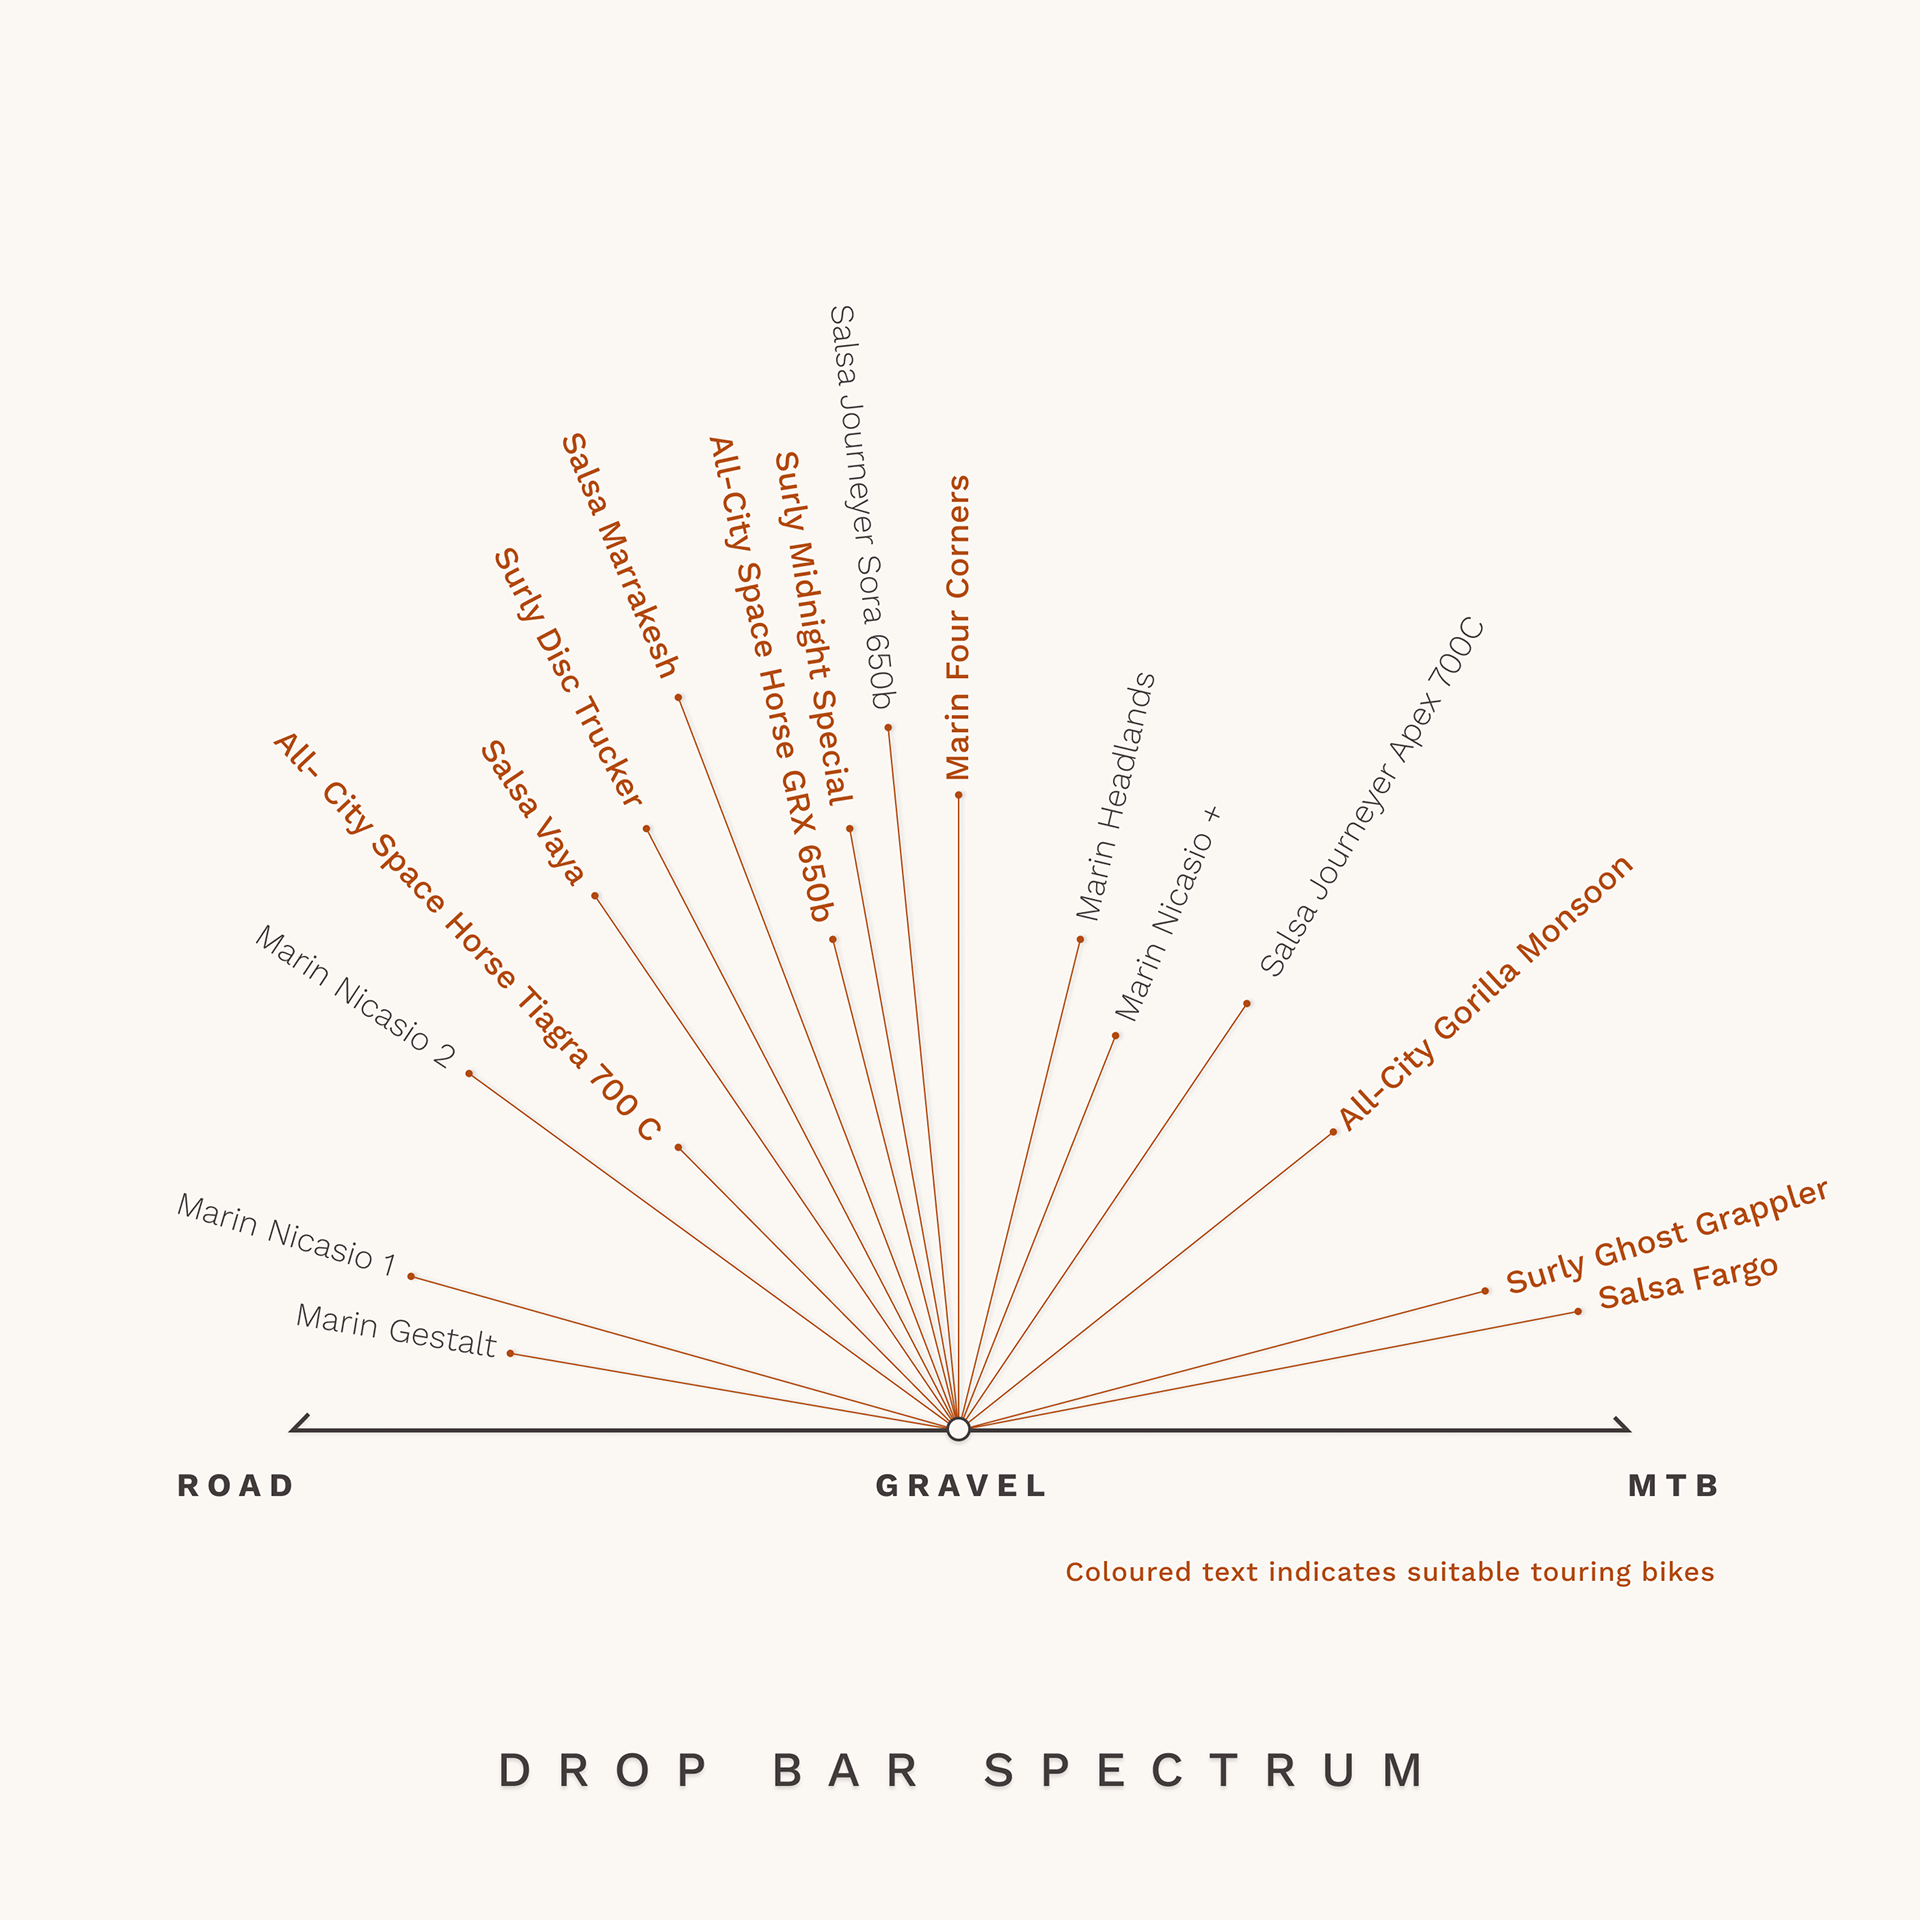
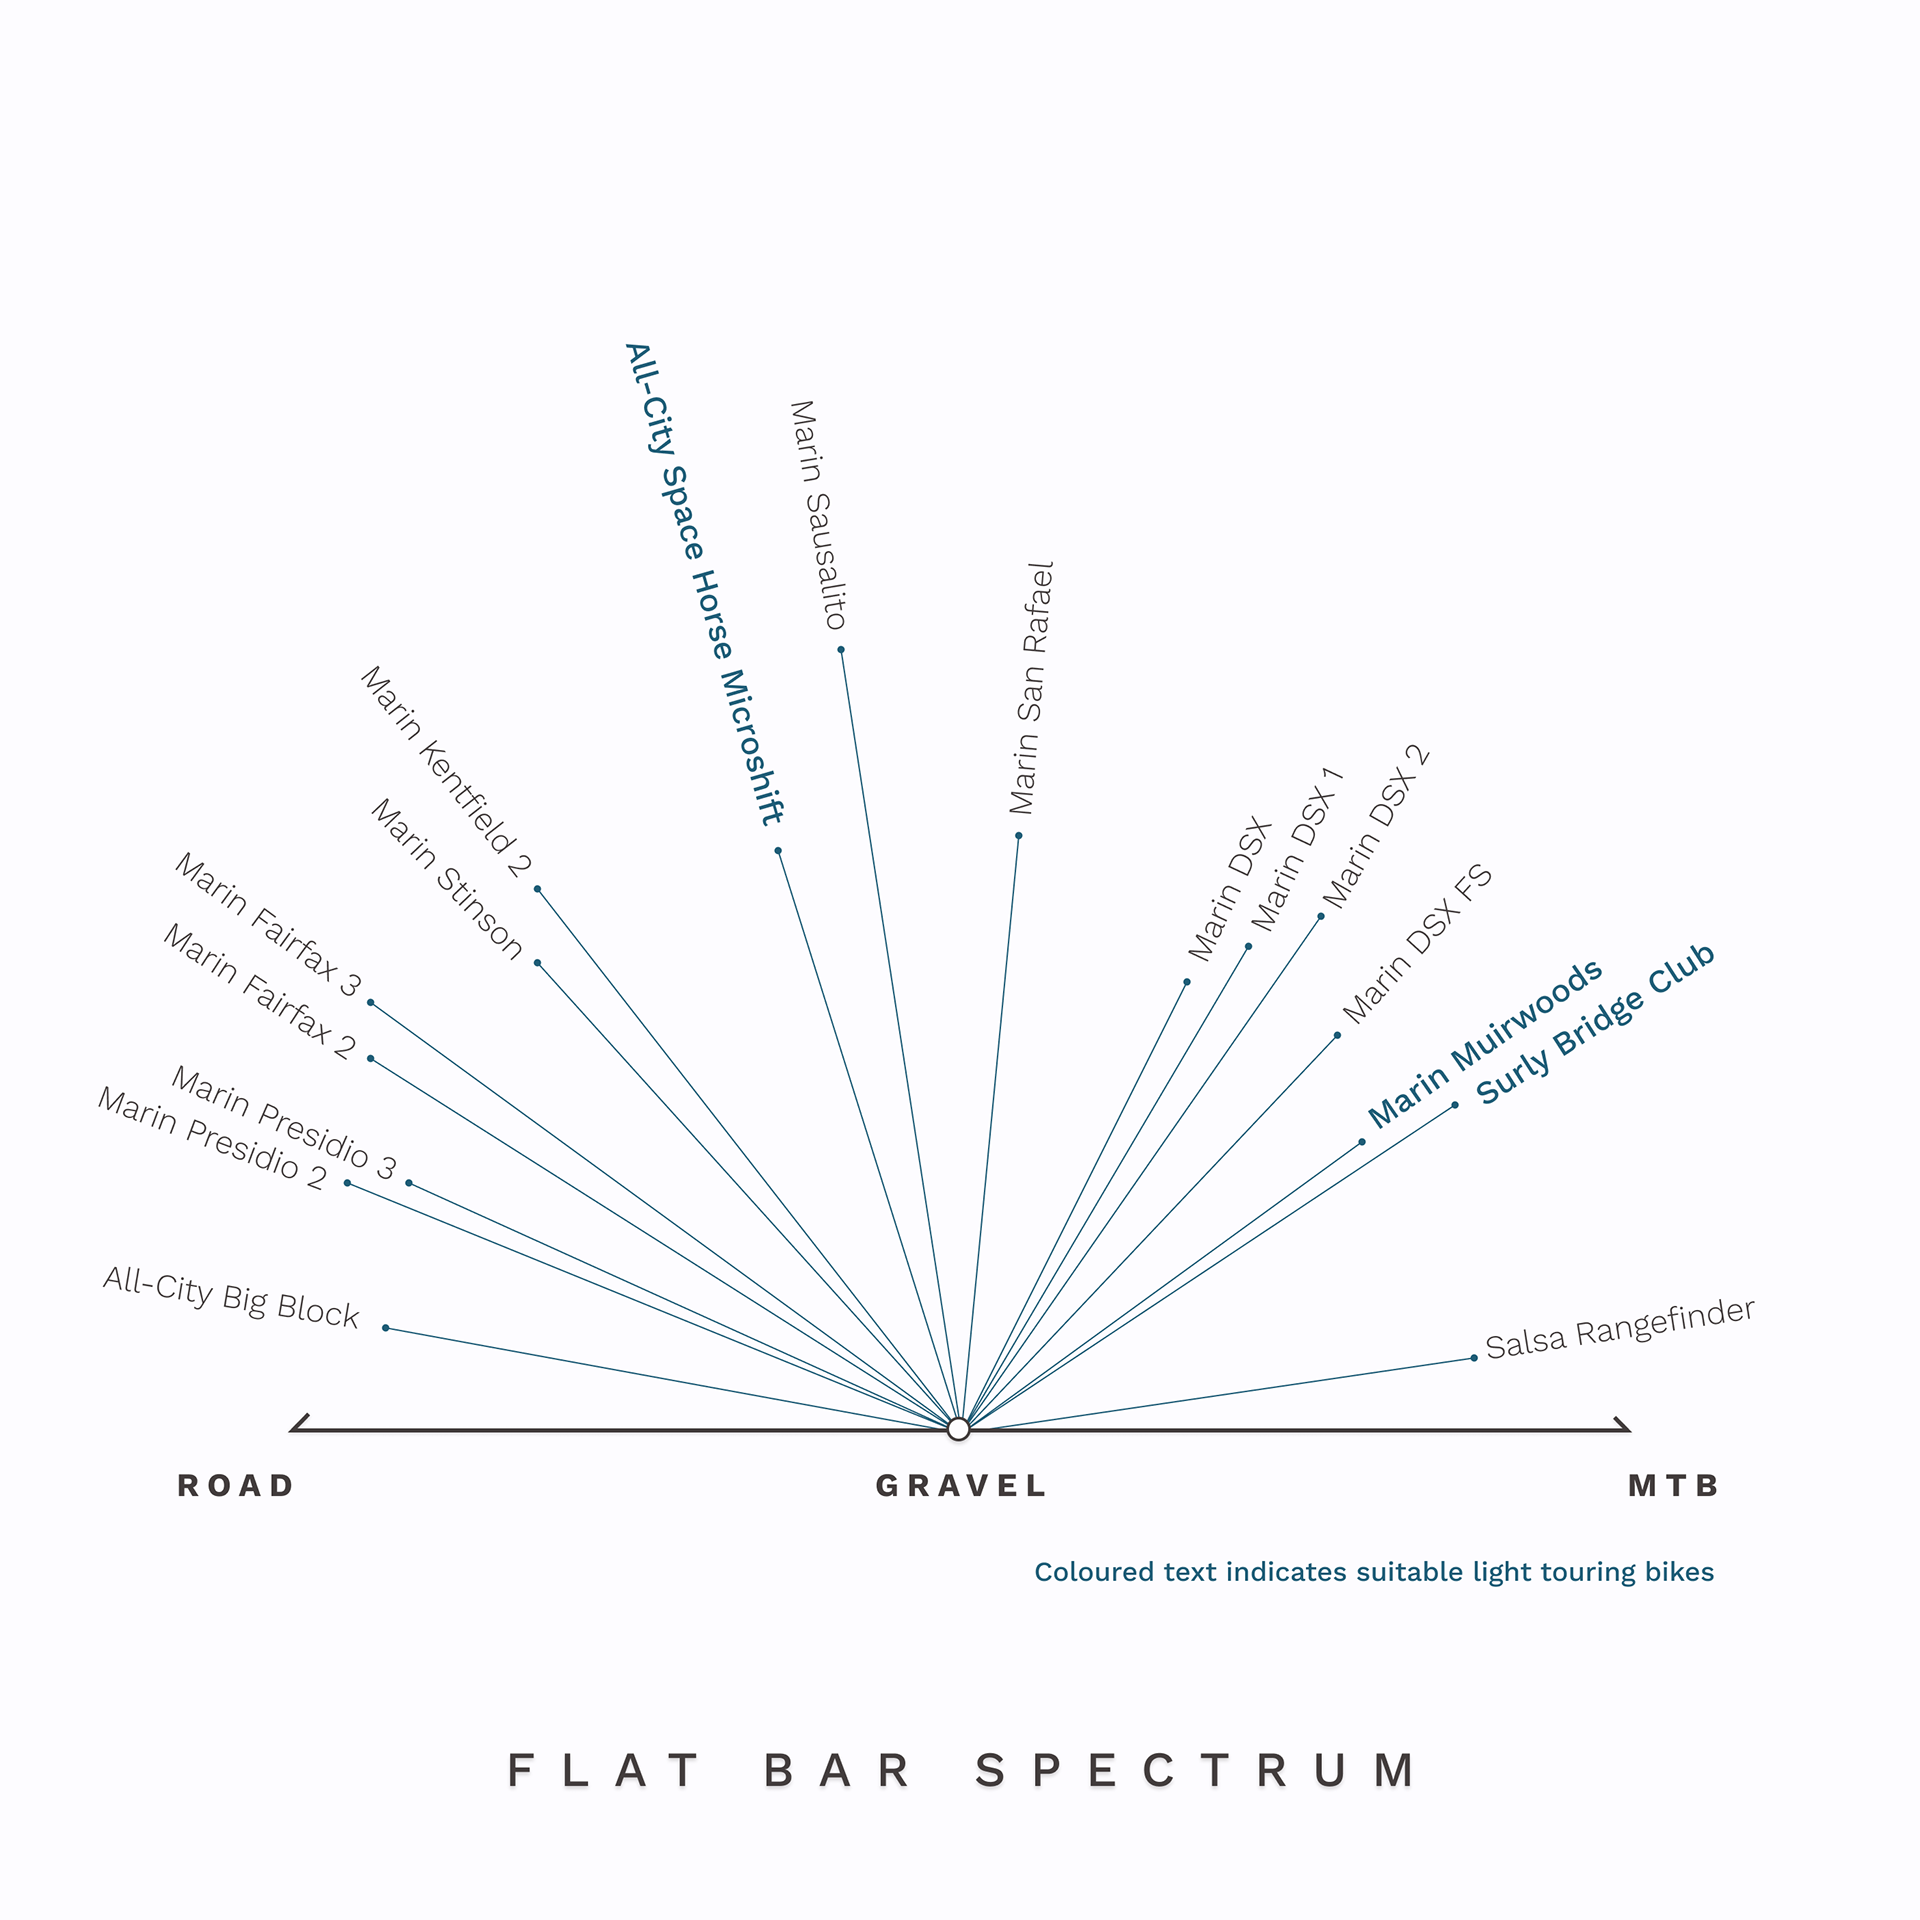
The Bike Spectrum
As a shop serving a wide customer base, there are a ton of different bikes available, and for people new to the world of bikes, it can be very intimidating to know what you need, and what you want. I created this data visualization to help customers evaluate bikes against their needs independently, and to serve as a visual aid for sales staff. I also wrote this accompanying blog post, explaining the differences between road bikes, mountain bikes, and gravel bikes.
Bikes sold at the shop were evaluated based on their material composition, tire size, and frame geometry and ranked based on their suitability for road cycling applications and mountain biking applications. The radial lines demonstrate where they lie on this ranking. The bikes' carrying capacity and distance capability were also evaluated to determine their suitability for bike touring, indicated here with bold colour text. There are two visualizations here, one for drop bar bikes, and another for flat bar bikes.
I hope this helps you learn something about bikes, their applications, and which bikes are suitable for which types of riding! And if you fail to learn anything from it, I hope at least that you think it looks neat.